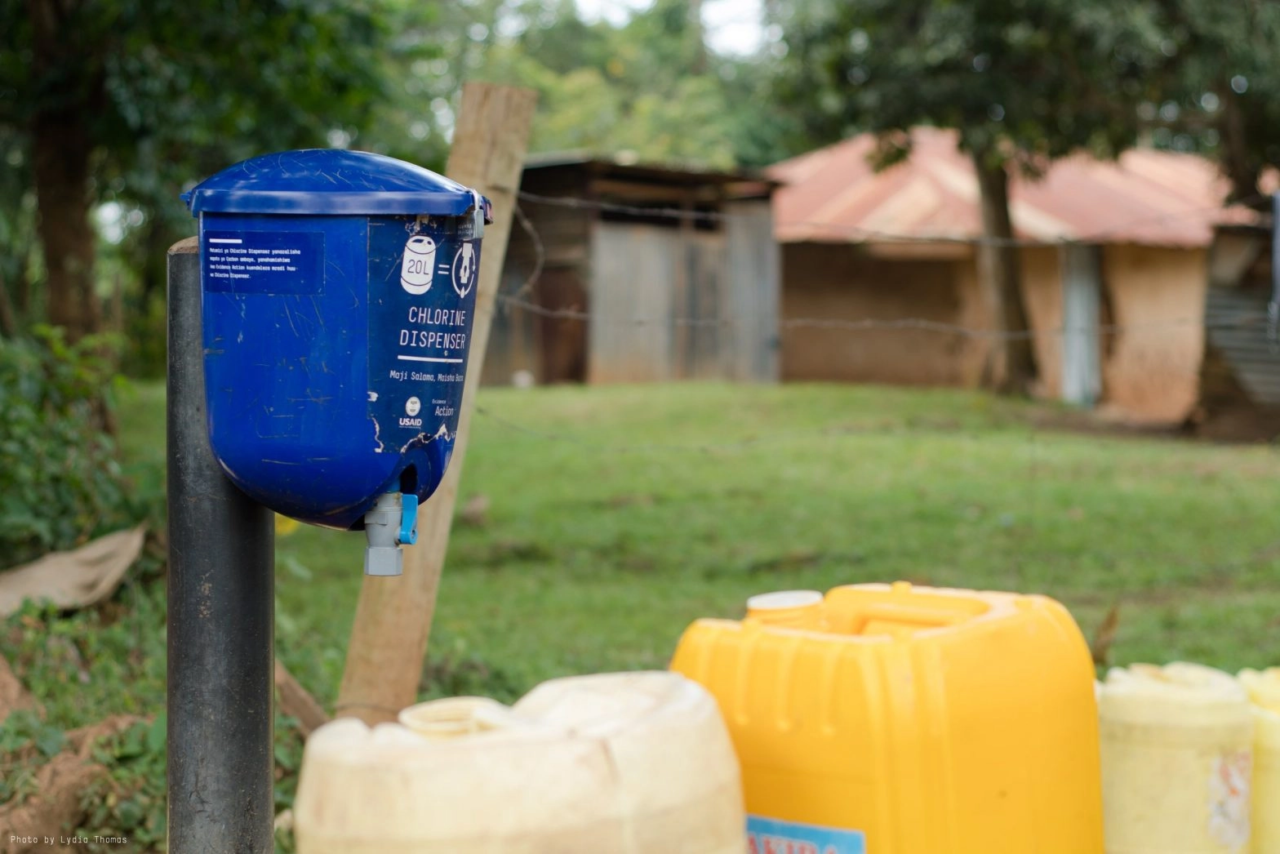
When new evidence revealed that water chlorination could reduce child mortality by more than 20%, we made the decision to rapidly scale our chlorine dispenser operations to a footprint of more than 50,000 devices across Kenya, Uganda and Malawi.
Chlorination offers something rare: an intervention that is inexpensive, effective, and comparatively straightforward to implement. Unlike large water infrastructure projects, chlorine dispensers can be quickly installed in remote areas at low cost — directly targeting diarrheal diseases that cause severe illness and kill over 1,200 children every day.
But now, new evidence shows far fewer people were using our dispensers than we thought. As a result, we are scaling back our chlorine dispensers in Malawi and Uganda: ending operations in Malawi entirely and narrowing our focus in Uganda to 55% of our current reach. We'll transition responsibly over 24 months, pursuing government handover where possible.
This follows our similar decision in Kenya last year, when external data led us to phase out about 56% of our dispenser footprint there.
What We Found
After discovering lower-than-expected adoption rates in Kenya, we worked with GiveWell to engage the Development Innovation Lab (DIL) to conduct a fully independent evaluation in Uganda and Malawi with data collection by Innovations for Poverty Action (IPA).
The evaluation showed far fewer households treating their water than our monitoring indicated. While we overestimated how many people had access to dispensers, the larger problem was adoption: among households with access, actual chlorine use was roughly a third of what we had measured.
Combined, this means 70% fewer people had detectable levels of chlorine in their water than our monitoring indicated.
We've dug into what went wrong with our monitoring which we'll explain below. First, what this means for the communities we serve.
The Decisions We've Made – And What They Mean for Communities
The survey findings fundamentally change our understanding of the program's cost-effectiveness, as lower adoption means higher cost per person helped. We’re decreasing our dispensers footprint in certain geographies so that we can focus our safe water work on areas where we believe we can have more impact – ultimately saving and improving more people’s lives.
How We Made These Decisions
We measure cost-effectiveness as the cost to prevent one year of life lost to death or illness (cost per DALY averted).We use a high bar: our programs must cost less than $690 per DALY averted. This threshold is based on ½ of GDP per capita averaged across the countries where we work, compared to the World Health Organization's "highly cost-effective" threshold of 1x GDP per capita.
Why so strict? Because every dollar has an opportunity cost, and continuing less cost-effective programs is ultimately choosing to help fewer people.
Based on our models using the revised reach and adoption data from DIL (as of November 2025):
As with all cost-effectiveness analyses, these estimates depend on assumptions – including around adoption rates, disease burden, and operational costs – that may shift over time. We present them as our best current understanding.
How We’re Managing the Transition
In Uganda and Malawi, hundreds of thousands of people who currently use our dispensers will lose access. Some have relied on these dispensers for years as their primary source of safe water.
The 24-month transition timeline – longer than sector norms – reflects the reality that finding alternative safe water sources takes time, particularly in rural communities where options are limited. As we reduce our dispensers footprint, we want to do so responsibly, stewarding our impact and centering community needs.
During the transition, we are:
How Our Dispensers Monitoring Works (And Where It Failed)
Our cost-effectiveness estimates – and, ultimately, our understanding of our impact – depend on accurate measurement of two key inputs.
First: Who has access to a dispenser? This is complex because water points don’t follow village boundaries, households may use multiple sources, and usage varies by season.
Second: Among those with access, how many actually chlorinate their drinking water? To answer this, we sample households from our user lists and test for chlorine residual in their drinking water.
Where Our Monitoring Failed
Our monitoring systems require trade-offs between cost, rigor, and frequency. We prioritized frequent data collection to inform real-time program decisions, and managed the cost of this by employing our own data collectors and managing monitoring internally. A comprehensive census-based survey across 50,000+ water points would have been prohibitively expensive, so we relied on community promoters — the same volunteers who maintain dispensers and encourage usage, and therefore know the community’s water habits best – to frequently list households using a sample of water points.
Our approach had known risks, and leading researchers reviewed our methodology at program outset to inform risk mitigation. We now know that as our approach evolved over time, we didn't maintain adequate safeguards against these risks.
The primary failure was structural: our monitoring system lacked sufficient independence, and this created conditions where bias could enter at multiple points.
We had multiple checks in place as part of quality assurance that didn’t catch these issues: supervisors conducted phone-based follow-ups with 5-10% of surveyed households; electronic data collection enabled analysis of GPS coordinates, timestamps, and response patterns; we flagged statistical outliers for investigation. But this verified procedural quality rather than ensuring data reliability. Our quality assurance was not designed to detect the biases that can occur when those collecting and providing the data are closely connected to the program.
New Data Revealed Operational Challenges
Discovering this discrepancy prompted a deeper question: if our monitoring was overstating adoption, why were actual rates so low in the first place?
Our ongoing investigation points to behavior change as a key challenge, though, we’re also exploring operational factors to learn the extent to which they contributed.
Based on data from DIL’s evaluation, we estimate approximately 30% of dispensers sampled lacked chlorine. The underlying causes have not been fully determined, but may include mechanical malfunctions, supply chain disruptions, and challenges related to our operational model for refilling chlorine in dispensers across remote rural areas.
But operational gaps don’t fully explain the adoption shortfall. The data showed that some families found ways to chlorinate their water even when dispensers were empty, while others chose not to chlorinate even when a filled, functional dispenser was available — patterns that, taken together, point to behavior change as a significant constraint on adoption.
This distinction matters for our path forward. A monitoring problem can be fixed with better protocols and protocol adherence, and some operational problems can be addressed through stronger program management. But if a behavior change challenge proves dominant and resistant to intervention, sustained adoption becomes harder to achieve than our model assumed.
For our retained footprint, we're actively working to understand and address these barriers by developing community engagement and behavior change strategies informed by local context, including known drivers like chlorine taste and odor. We will be monitoring how these adjustments affect our operations and adoption rates, and expect to see some improvement.
Strengthening Our Monitoring
Identifying where monitoring failed is necessary, but it's not sufficient. We’re focused on two areas now: immediate fixes to our safe water adoption monitoring, and assurance that similar vulnerabilities don't exist elsewhere in our portfolio. We're acting on both.
Chlorine Dispenser Adoption Monitoring
We're implementing changes now, while working towards a full monitoring redesign.
We have already incorporated enhanced protocols and quality assurance procedures, including photo verification of chlorine test results, digitized household selection to reduce sampling bias, and enhanced training. We’re also exploring integrating periodic external validation with improved protocols to address accuracy concerns while preserving cost-effectiveness.
Reviewing Monitoring Across Our Portfolio
We're examining monitoring protocols across our entire portfolio, looking at each program's vulnerability to risks, including and beyond the types of bias that affected our dispenser monitoring.
Although this review is ongoing, we believe no other at-scale programs outside of our dispenser and in-line chlorination programs in Africa carry a similar level of risk. Our India in-line chlorination and non-water programs use external contractors for data collection, cross-check against multiple independent sources (such as supply records, provider surveys, and facility registers), follow internationally recognized standards like WHO protocols for deworming, and sample from government administrative data rather than promoter-generated lists.
That said, out of an abundance of caution, we're engaging external experts to review monitoring protocols across our entire portfolio in 2026 to ensure our practices give us—and you—an accurate picture of our impact.
In-Line Chlorination: Where We Stand
Our safe water portfolio includes a second delivery method – in-line chlorination – that serves a different context than dispensers.
Dispensers are designed for rural communities without piped water infrastructure – places where families collect water from shared sources like boreholes and springs. In-line chlorination, by contrast, works where piped systems already exist, integrating chlorine dosing directly into community water infrastructure so that treated water flows from taps.
In-line chlorination faces fewer behavior change barriers because it doesn't require households to take an extra step of chlorinating water at a water point — for many people, safe water simply arrives at their communal taps or in-home connections. It also has potential to treat higher volumes of water, reaching more people more efficiently.
Given what we've learned about dispenser monitoring, a natural question is whether similar issues affect in-line chlorination. The answer depends on geography.
We have significantly higher confidence in monitoring for our India in-line chlorination program. It benefits from structural protections that were absent in East Africa: data collection uses external contractors rather than internal staff, reach estimation relies on documented household lists rather than promoter-generated samples, and we can validate our monitoring against government water quality databases. The program model also differs by delivering impact through government technical assistance as opposed to direct service delivery – affording a much larger pathway to scale.
That said, the technology is still maturing. Implementation requires calibrating devices to local conditions, managing variable flow rates, and ensuring communities understand and accept treated water.
Uganda and Malawi In-Line Chlorination Evaluation
We asked DIL and IPA to evaluate our in-line chlorination program in Uganda and Malawi alongside dispensers. Although we haven't finished analyzing or validating the data, preliminary results suggest lower adoption rates than we previously estimated and similar monitoring challenges.
This is not surprising since our in-line chlorination monitoring in East Africa relied on the same monitoring design as dispensers, and we're working to fix both.
But we're also continuing to develop the program rather than scaling back. In addition to the structural advantages described above, there's more room to improve. In-line chlorination is early enough that operational challenges — device calibration, visit frequency, infrastructure variability — remain addressable. We're standing up a dedicated team focused solely on optimization in Africa and will develop revised monitoring protocols informed by what we've learned.
Our Continued Commitment to Safe Water
After these transitions, we will continue operating approximately 18,000 dispensers across Kenya and Uganda, reaching an estimated 2.8 million people in areas where the program delivers the most impact. We will continue to evaluate cost-effectiveness across this footprint as we refine our monitoring.
We also remain committed to developing in-line chlorination with the government of India — a partnership we believe can reach tens or even hundreds of millions of people. Our work supports the technology, policy, and capacity-building India needs to make water safety a lasting public health priority.
Although we’re reducing our dispenser footprint, these discoveries and our resulting decisions don’t invalidate the intervention itself – only our understanding of adoption in specific geographies. Even with the challenges we've identified, we're proud to have provided access to chlorine-treated water to 1.9 million people in Malawi and 3.3 million people in Uganda who wouldn't otherwise have had it. Piped infrastructure is expanding, but it will be years, even decades, before many rural communities have access. In the meantime, point-of-collection chlorination is a proven, low-cost way to protect families from waterborne disease.
Two billion people globally still lack access to safely managed drinking water. Diarrheal disease remains a leading cause of child mortality. The importance of safe water delivery has not changed.
What's changed is our understanding of where and how we can deliver safe water most effectively, and a deeper humility about what we don't know.
"That kind of collaboration, that willingness and desire to be transparent, even when the news might not be good, that is not something that you should take for granted. That's extremely rare in the nonprofit world. And we are extremely grateful to Evidence Action, and to other organizations that we work with, that they engage with us in that way."
CEO and co-founder · GiveWell