Summary
New evidence shows that our chlorine dispenser program in Kenya is less effective than previously thought: new data shows that an estimated ~40% fewer people use dispensers than we previously believed.
These results - combined with decreasing disease burden and improving health outcomes in the areas we have dispensers - have updated our understanding of chlorine dispensers’ cost-effectiveness in Kenya, leading us to decide to phase out roughly half of our Safe Water Now chlorine dispenser programming in Kenya.
This is not a decision we made lightly, as we know the important role that safe water can play for the families and communities we serve. We know this transition will be challenging for many, and we’ve felt that deeply as a team.
We’ll work closely with affected communities, partners, and our staff to ensure a responsible transition in the geographies we’re exiting. We have an 18-month roadmap to phase out operations, including engaging communities on alternative safe water practices.
Acting on the best available evidence – even when the implications are difficult – is core to who we are, whether in scaling up lifesaving interventions, transitioning out of low-prevalence geographies, or closing programs. Before coming to this conclusion, we explored multiple options and sought external perspectives. In the end, we decided to reduce our footprint, focusing our resources on the highest-impact programming to ultimately save and improve more lives.
We’ll continue operating in the most cost-effective geographies in Kenya and will iterate program design to maximize our impact. We are also supporting independent surveys in Uganda and Malawi to validate usage for both dispensers and in-line chlorination, in partnership with the Development Innovation Lab, GiveWell, and Innovations for Poverty Action.
We do not think that this issue affects our non-water programming. Our other programs are less susceptible to these types of measurement errors for a number of reasons (e.g., they do not involve community-based estimates of catchment populations, require measurement tools similar to those needed to detect chlorine, etc.).
We are proud of what this program has achieved and are equally committed to holding ourselves accountable when the evidence shows a better path forward. In a world of limited resources, making difficult decisions like this one is how we work toward our vision of measurably improving lives: by ensuring we do the most good we can, with what we have.
Research has consistently shown water treatment is a highly impactful investment, leading to the launch of Dispensers for Safe Water.
Water treatment has consistently been shown to significantly reduce diarrhea - one of the greatest killers of children in the developing world. Rigorous research from Kenya between 2008 and 2011 demonstrated the effectiveness of point-of-collection chlorine dispensers. This innovative solution design - informed by behavioral science - led to 5x higher uptake of water treatment than individually packaged chlorine.
Given the strength of the evidence and the intervention’s cost-effectiveness, Evidence Action scaled dispensers programming across Kenya starting in 2013, and later launched operations in Uganda and Malawi. This work is part of our broader focus on safe water access, which also includes in-line chlorination.
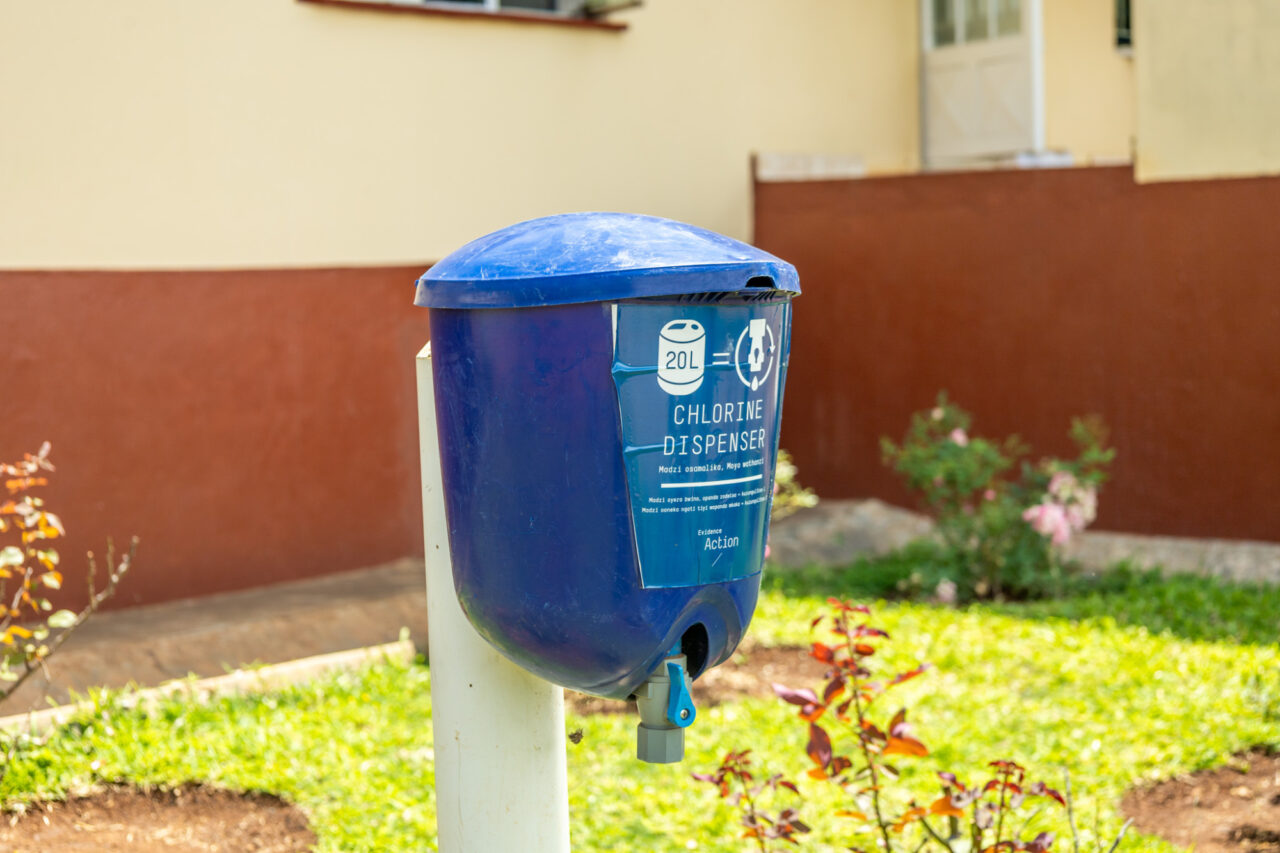
Our chlorine dispensers are designed to serve communities not reached by municipal systems. They’re installed right next to water sources, making it easy for people to use them. Community members go to their water source, place their bucket under the dispenser, turn the valve once to deliver the correct dose of chlorine, then fill their bucket with water. The chlorine disinfects the water during the walk home, so by the time they arrive, it’s safe to drink.
Our approach emphasizes continuous learning and program design iteration to maximize impact for the communities we serve.
We regularly review our programs against new data to ensure the best use of scarce resources – informing decisions on program expansion, design, or exit when they fall short. Some of the examples of how we’ve pressure tested our Safe Water Now program include:
- Launching an expert-led comprehensive evidence review in 2017 to assess whether the evidence base still met our standards. Examining the links between chlorine treatment, water quality, and health outcomes, this review reaffirmed chlorine's effectiveness and its contribution to reduced diarrhea and child mortality.
- Incorporating groundbreaking 2021 research from Nobel Laureate Michael Kremer that showed water treatment reduced all-cause child mortality by nearly 25% – increasing cost-effectiveness, and leading us to nearly double the size of our program, with a focus on Uganda and Malawi.
- At a more operational level, driving design decisions that compound over time. We’ve developed 5 generations of dispensers, saving almost 50% in costs over time while increasing durability and deliverability.
Today, new data on dispenser usage, combined with reductions in Kenya’s disease burden, have updated our understanding of chlorine dispensers’ cost-effectiveness in Kenya.
Our monitoring systems balance cost-effectiveness, scale, and rigor in resource-constrained settings.
To design an adaptable yet robust monitoring system for chlorine dispensers at program launch, we consulted with global experts to develop a household-level chlorine testing protocol, enabling us to collect adoption data from the end-user. This surveying approach has unique complexities compared to typical program monitoring approaches (e.g., tracking distribution or access). We collect data across nine counties in Western Kenya on a quarterly basis, providing timely and actionable insights for the program - and requiring a field monitoring team who could continuously implement this approach across our footprint of over 18,000 dispensers.
When designing complex monitoring, we must balance scale, range of contexts, practicality, and cost-effectiveness. To give a sense, here are some of the questions we partnered with experts to answer:
- How do we identify which households have access to a dispenser? → We decided to leverage community volunteers, who list eligible households to be visited for monitoring, rather than conducting an expensive and time-consuming census-like process to identify households.
- How do we monitor for household usage of chlorine while maintaining low costs? → To measure chlorine residual in water, we use color wheels instead of digital colorimeters. Color wheels are a more accessible tool and cost considerably less than colorimeters (~80% less), but colorimeters have higher accuracy.
- How do we continuously monitor program uptake? → We chose to prioritize routine, in-house data collection conducted by our staff, instead of hiring external firms for data collection, which were more expensive and expected to be comparable in accuracy.
Once established, monitoring is an iterative process – over time, we continued to strengthen our approach through:
- Creating an independent monitoring, learning, and evaluation team
- Switching from paper to digital data collection with built-in quality checks
- Adding regular audits to verify data accuracy
- Building dashboards that give teams quick access to results
- Running regular evidence reviews paired with monitoring assessments (e.g., in 2023, working with GiveWell to update our sampling approach to collect more data points to increase precision)
New analysis in early 2025 showed that an estimated ~40% fewer people use dispensers than we previously believed.
An assessment of chlorine dispenser usage we ran in Kenya showed an estimated 566,000 people in Kenya are chlorinating their water using dispensers – a ~40% reduction from our previous monitoring estimate of 898,000. Because results varied depending on how the data was collected, there is some uncertainty in this updated figure. We’ve used a ~40% reduction as our best estimate, but it should be taken as directional rather than exact.
This assessment was born out of discrepancies flagged by researchers from the Development Innovation Lab (DIL) studying chlorination practices in regions where we operate in Kenya, whose work showed meaningfully lower usage data than our monitoring data. While some range in adoption data is normal - given human behavior inherently fluctuates - these discrepancies were larger than expected variance.
DIL surveyed all households within their study area, which overlapped but was not the same as our program footprint. Given the meaningful differences in design, time, and location of data collected, their results weren’t directly comparable to our monitoring estimates.
To build a better picture of current dispenser usage, we designed, with expert input, surveys to (i) detect discrepancies in our monitoring approach, and (ii) get a more robust estimate of chlorine use. Our surveys compared two data collection approaches in the same Kenyan villages at the same time - a census (similar to DIL’s study) and our existing monitoring methods. The census-based approach is more costly and time-consuming than our standard program monitoring and is typically used in research settings where precision is paramount.
This identified two patterns of inaccuracy in our monitoring, with opposite impacts on program adoption. Our updated picture includes:
- Increasing our estimate of the number of people with access to our dispensers by 11%. We saw about 2.3 million people in Kenya had access to our dispensers.
- Diagnosis: We are confident that this is driven by our data collection approach, asking volunteers to name households that use dispenser water points. This was a practical design choice to scale cost-effective monitoring that we were aware could introduce imprecision and led to systematic undercounting.
- Diagnosis: We are confident that this is driven by our data collection approach, asking volunteers to name households that use dispenser water points. This was a practical design choice to scale cost-effective monitoring that we were aware could introduce imprecision and led to systematic undercounting.
- Reducing our household adoption rate estimate by ~45%. We initially estimated a 44% household adoption rate, which we now believe is closer to 24%. This portion of our estimate has a larger degree of uncertainty.
- Diagnosis: These errors occurred at the point of data collection and could be related to design challenges, implementation challenges, or both. We’re investigating multiple hypotheses, including sampling error, human error, enumerator bias, and data collection error.
Combined, we estimate ~40% fewer people are using dispensers than previously believed.
These results - combined with decreasing disease burdens - have updated our understanding of program cost-effectiveness, leading us to decide to scale down roughly half of our Safe Water Now chlorine dispenser programming in Kenya.
Over the past 12 years, Kenya has undergone remarkable transformation. GDP has nearly doubled, infrastructure has improved, and under-5 mortality has declined by more than 25%. This is great news, and reflects the improving living standards we aim for.
At the same time, these socioeconomic changes have a downward effect on our cost-effectiveness calculations, reducing the relative impact of the program.
As Kenya has developed, certain regions have experienced greater improvements in health metrics and infrastructure. In these areas, lower disease burden combined with lower adoption rates means portions of our dispensers' footprint no longer meet our rigorous internal standards for cost-effectiveness, even as they continue to generate impact. The counties we are exiting are generally those that have seen the most decline in child mortality.
By most commonly used thresholds, our Kenya dispenser program remains "highly cost-effective." But our internal bar is higher – because we measure impact not just in isolation, but in comparison to what else we could do with the same resources. Other programs in our portfolio can deliver up to six times more impact per dollar, representing a significant opportunity cost – resources deployed here could achieve substantially greater impact elsewhere.
We will focus Kenya chlorine dispensers on the most cost-effective geographies within the country - continuing to provide access to safe drinking water access to 1 million people.
During this transition, we are:
- Maintaining operations in counties with the strongest cost-effectiveness (44% of our footprint), served by our Awendo and Chavakali offices. We will be taking additional steps to improve our cost-effectiveness in these areas.
- Phasing out dispenser operations supported by our offices in Busia, Ugunja, and Matunda over 18 months (56% of footprint) – an extended period designed to ensure a responsible transition.
- Engaging in transparent communication with affected communities, providing both advance notice and participatory planning with local communities and governments on approaches for continuing safe water practices.
- Actively working with affected staff — many from rural and economically disadvantaged communities where formal employment opportunities are limited — to develop appropriate transition support. This may include financial considerations, career development resources, and other personalized assistance.
This is not a decision we took lightly. Staying true to our evidence-driven approach means making difficult choices like this one. By concentrating our efforts in the most promising areas, we can deliver safe water access to the communities that need it most, averting more disease and saving more lives.
We are supporting independent surveys in Uganda and Malawi to validate usage for both dispensers and in-line chlorination.
We take these discrepancies in monitoring seriously, and are obtaining additional data from our other safe water programs in Africa. We are supporting the Development Innovation Lab, GiveWell, and Innovations for Poverty Action to conduct surveys on our chlorine dispensers and in-line chlorination programs in Uganda and Malawi, using a similar approach to the recent Kenya survey we conducted. An independent evaluation team will use both a census methodology and our routine monitoring methodology to estimate program reach and measure chlorine usage.
We’ll use the findings from this work to confirm whether these programs continue to meet our internal standards for impact and determine potential ways to strengthen program monitoring. It’s possible that in different geographies, similar results could still lead to different program decisions, given local disease burdens and cost-effectiveness inputs.
In parallel, we’re investigating the root causes of the discrepancies discovered and adding new quality checks when appropriate during monitoring design.
Collecting data from only a sample of households is a necessity in monitoring at-scale programs. While we expect some deviation from the true adoption value with this approach, this was higher than anticipated. We're still assessing the root causes that led to this deviation and will use data from the Uganda and Malawi surveys as key inputs to this work. As noted above, we’re investigating multiple hypotheses, including sampling error, human error, enumerator bias, and data collection error.
Our assessment of root cause will inform additional changes we make to our monitoring approach for dispensers, alongside inputs on cost and feasibility at scale. Potential changes could include:
- Updating our method for counting households with access to dispensers, including revising how we ask our questions to elicit this information, introducing new methods (such as using geospatial data), or triangulating multiple methods.
- Establishing additional approaches for verifying our monitoring results, such as integrating more triangulation (e.g., comparing against operational data) or conducting periodic independent data validation (e.g., surveys).
- Refining our protocols on chlorine testing methods and management of data collectors to strengthen chlorine testing reliability. This could be achieved through closer protocol monitoring, confirming that chemicals in water samples aren’t causing inaccurate readings in the chlorine tests, or mitigating bias risk through strengthening protocols and training.
Going forward, we're adding to the existing quality checks detailed above for monitoring designs susceptible to a larger potential range of errors. In practice, this will look like assessing the range and type of potential errors that may arise with program monitoring approaches at inception, determining appropriate mitigation strategies, and identifying additional data sources if there is low confidence in mitigation strategies. It’s possible in some cases, we choose to forgo investing in additional data, e.g., if it is prohibitively expensive to do so or even if with large errors we still believe a program would be highly cost-effective.
We will never be able to mitigate all risks inherent in the complexity of the monitoring of any program - but will continue to hold our programs to the standard of capturing the truest possible picture of impact while maximizing cost-effectiveness.
We believe our other programs are less susceptible to these types of errors for a number of reasons.
Our other programs rely on other data collection approaches, external monitoring partners, and different sampling approaches. Chlorine dispensers’ distinct monitoring models give us confidence that the issues identified in Kenya’s dispensers program are not present in other programs like Deworm the World, Equal Vitamin Access, and Syphilis-Free Start. That said, we will be using what we’ve learned to review monitoring practices across our organization and strengthen where appropriate.
As we continue to refine these systems, we remain focused on what monitoring is ultimately about: accountability – to the communities we serve and the outcomes we strive for – which means constantly evolving to meet the demands of complex, real-world programs.
We’re proud to have provided 2 million people with safe water - and to hold ourselves accountable when the evidence requires us to change course.
We are proud of what our dispensers program in Kenya has achieved – 19,000 chlorine dispensers installed and safe water access extended to 2 million people each year since 2015. We estimate this intervention has prevented over 1 million cases of diarrheal disease and saved over 3,700 lives. These tangible impacts demonstrate why safe water remains a priority, even as we refocus our geographical footprint to maximize effectiveness.
And we are equally proud to hold ourselves accountable when the evidence requires us to change course. By embracing what the data tells us, we strengthen our ability to address communities' most urgent needs. Our efforts to protect families from waterborne disease will evolve, but not end.
In a world of limited resources and pressing challenges, the ability to assess, adapt, and pivot toward greater impact isn't just good practice – it's how we work toward our vision of measurably improving lives.