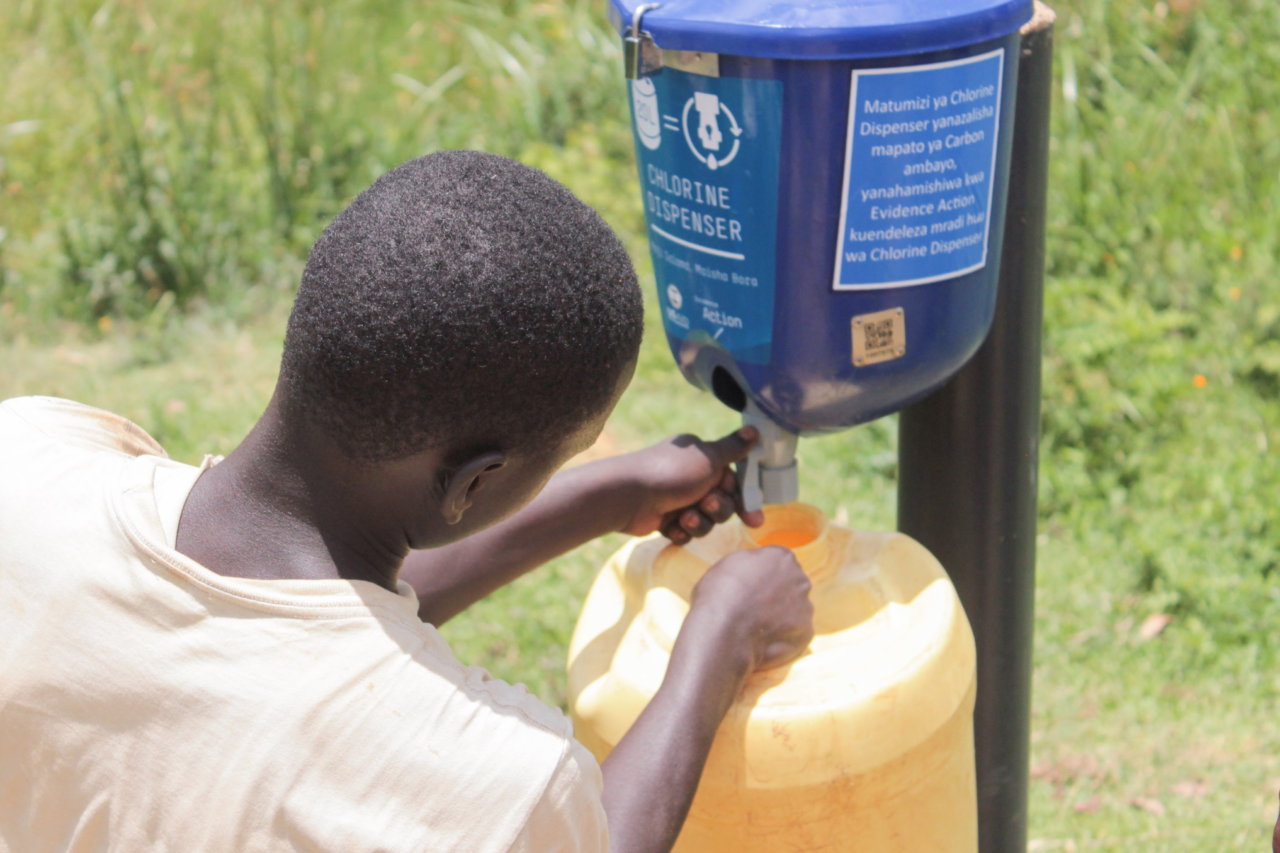
Rigorous research shows that installing chlorine dispensers right next to a water collection point is one of the most effective ways of enabling rural communities to treat their water. We combine this evidence from randomized evaluations with behavioral science insights and a strong, ever-improving product design to effectively deliver safe water access to nearly 4 million people in rural Kenya, Malawi, and Uganda through our Dispensers for Safe Water program – and we’re currently exploring a new model for expanding the program to Ethiopia.
Adoption rates are the most critical success metric for Dispensers for Safe Water. They reflect the proportion of households that have access to our chlorine dispensers and use them. Our monitoring team calculates adoption rates through bimonthly, unannounced visits to a random sample of households served by our dispensers. Team members test household water to check whether it was treated and if it is still good to use (chlorinated water remains safe to drink for roughly 2-3 days). The proportion of households whose water tests positive for chlorine is our measure of adoption.
As an organization focused on continuous improvement, we are always looking for ways to sustain and improve adoption rates. Over the last few years, our monitoring and learning team has sought to better understand the levers that influence adoption, and the degree of influence each lever has. We knew, from past research, that adoption improves significantly when local volunteers are used to promote the use of chlorine dispensers in communities, which is why we recruited a network of over 54,000 volunteer “promoters” to act as chlorine dispenser ambassadors in the communities we serve. As we’ve implemented Dispensers for Safe Water, our monitoring and learning team has teased out the insights from past research further, providing greater nuance to our understanding of households’ decisions to use chlorine dispensers. We’ve learned more about:
- Which household characteristics predispose a household to use the chlorine dispenser
- Which aspects of a promoter’s identity and/or behavior have an impact on households’ decisions to use chlorine dispensers
- How often households need to be engaged by local volunteer promoters
- The degree to which consistent chlorine availability and dispenser functionality affects households’ long-term use of dispensers
Our lessons, discussed further below, were gleaned through interviews conducted between 2015 and 2017 with 73,513 households across Uganda, Malawi, and Kenya that have access to our chlorine dispensers. We also interviewed volunteer promoters assigned to these households, seeking to learn more about promoters’ own dispenser use and engagement with households.
Digging into the data: What we’ve learned
Our data yields several interesting findings about the factors that influence households to use chlorine dispensers. We now know that there are innate household characteristics linked to dispenser use, including the gender, age, and literacy status of those in the household responsible for collecting water. Specifically, in both Uganda and Malawi women are more likely then men to chlorinate their water when collecting it, and the odds of water treatment increase when the person collecting the water has higher literacy and education qualifications. Additionally, households are up to 9% more likely to chlorinate their water when an adult (over 18) is responsible for collecting water than when a child is.
Further, we found that across all three countries of operation community members who knew how to use the dispensers and chlorine were 10% more likely to use a dispenser than those who didn’t. We also found that in Kenya and Malawi, households that interacted at least once a month with a community promoter were up to 89% (Malawi) more likely to use chlorine to treat their water.
Promoters’ behavior and education levels are also linked to higher chlorine use among households. When promoters make use of chlorine dispensers themselves, the households they engage are 12% (Kenya), 17% (Uganda), and 11% (Malawi) more likely to treat their water. When promoters have higher education qualifications, the households they engage are also more likely to treat their water. Finally, households are more likely to use chlorine dispensers if they interact with promoters at least once a month.
Perhaps unsurprisingly, we’ve also found that households’ use of chlorine dispensers drops dramatically and remains low for an extended period of time when households encounter dispensers that are empty.
From Evidence to Action
Over time, these insights have informed a variety of our program implementation decisions. For example, based on our understanding of:
- households’ need to regularly interact with community promoters
- community members’ need to see promoters “walking the talk” by using dispensers themselves, and
- households’ need to understand how to correctly use dispensers
we began conducting promoter “refresher” trainings in 2017 to remind volunteer promoters about the importance of their role, encourage them to frequently interact with households, and set an example for other community members by using dispensers themselves. We’re also currently testing the impact of providing promoters with a small pictorial handbook that shares guidelines about how they should conduct their role, including the frequency with which they should reach out to the households they serve, and that also includes information which they can use to educate community members about how and why they should use chlorine dispensers.
Our understanding of the importance of consistent chlorine availability and functional dispensers led us to step up efforts to ensure that chlorine is delivered and available exactly when it is needed. In 2015, for example, we piloted a call center in Western Kenya, with hotline numbers that promoters could call to report chlorine shortages or dispenser break down. Now a key part of our Kenya and Uganda programs, the call center allows us to quickly respond to promoters’ requests by prioritizing chlorine delivery or sending our staff to fix dispensers.
Guided by our commitment to evidence and iteration, we continue to use these insights and determine new research questions to inform program design. Our monitoring team is undertaking research to assess characteristics that make for an effective promoter, with the aim of improving promoter recruitment and selection.. We will share more as analysis is conducted. Look out for future updates on how we are using data to drive demand for our chlorine dispensers!