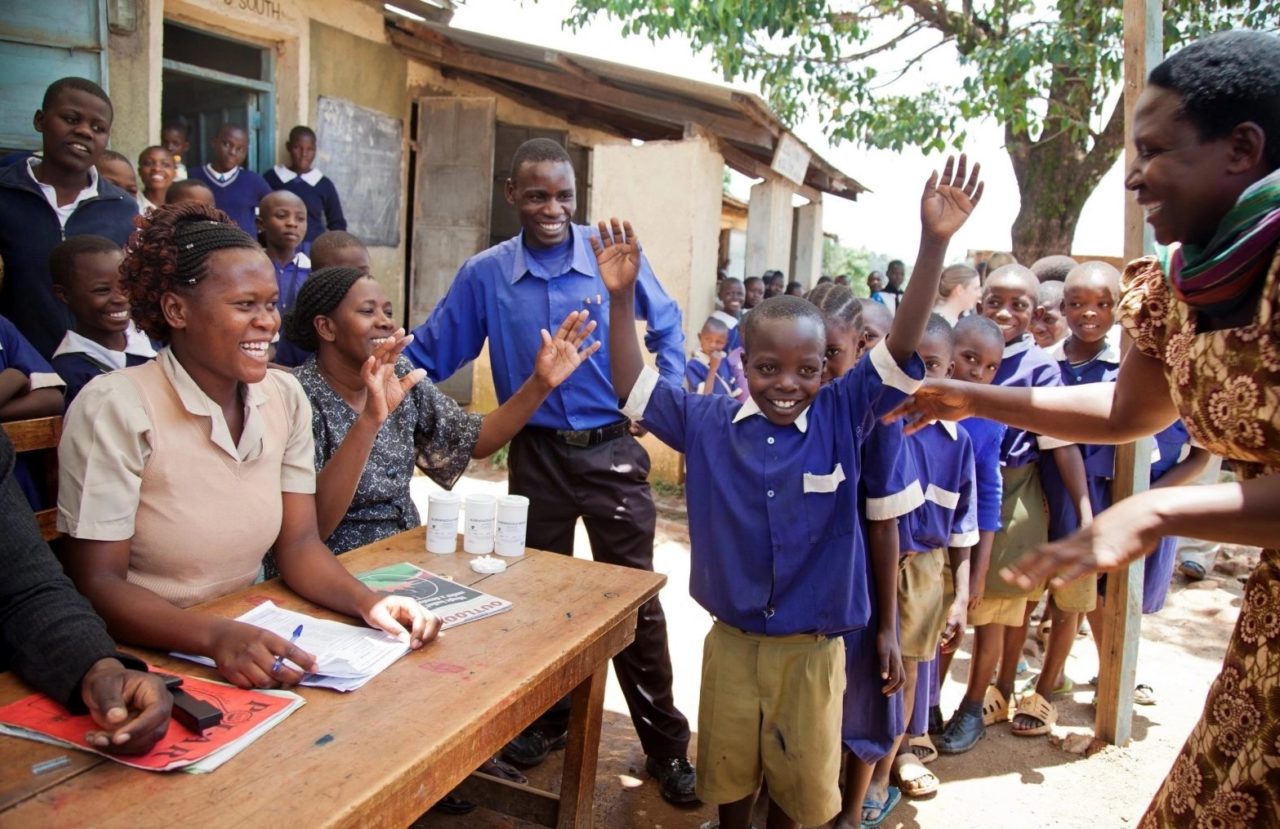
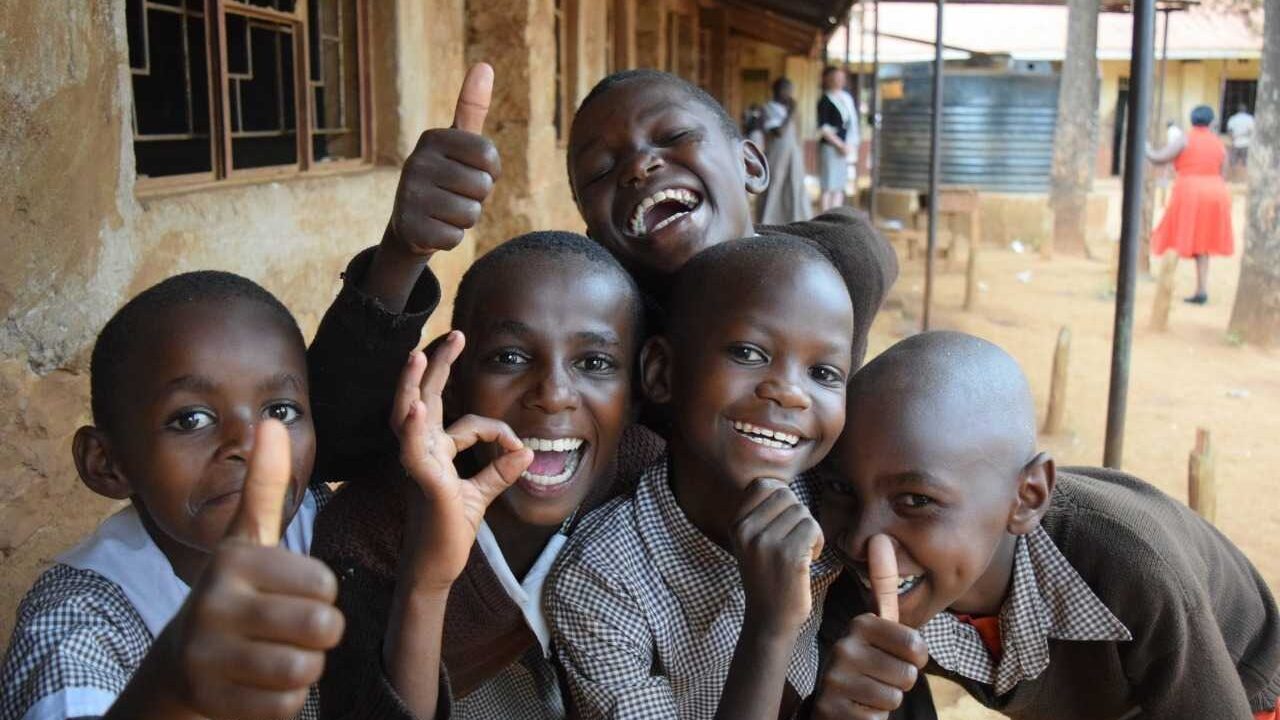
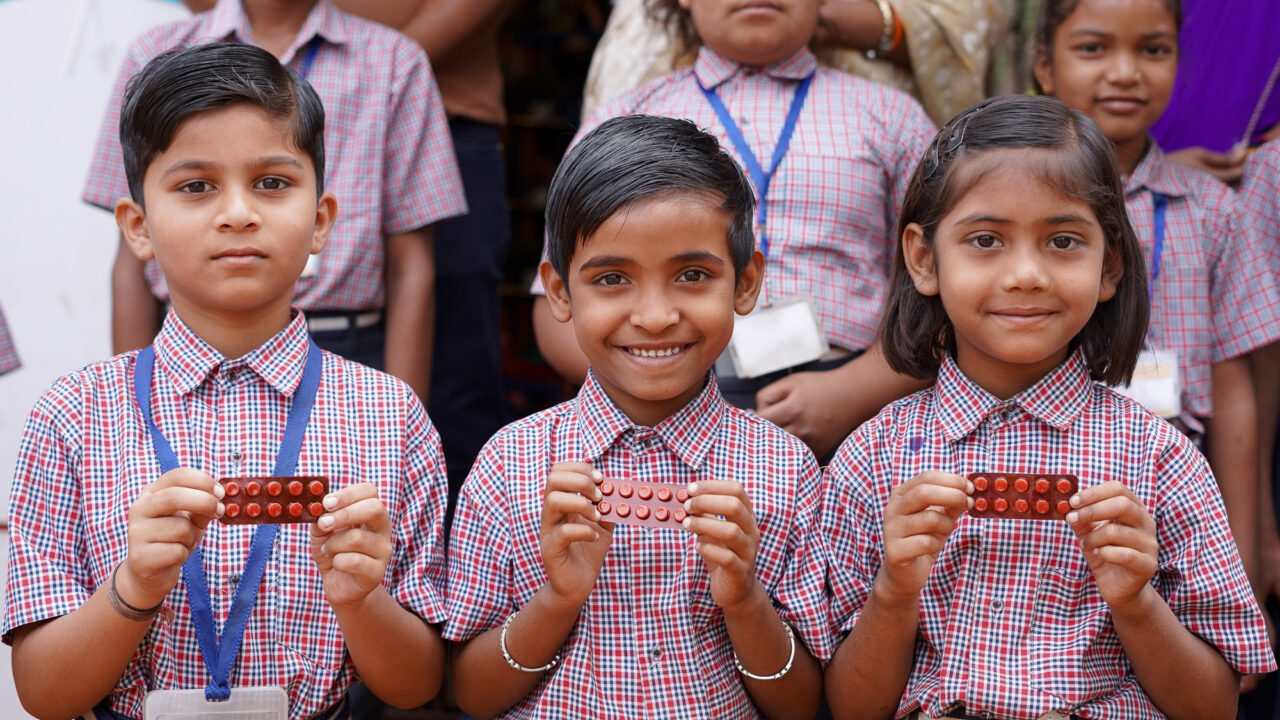
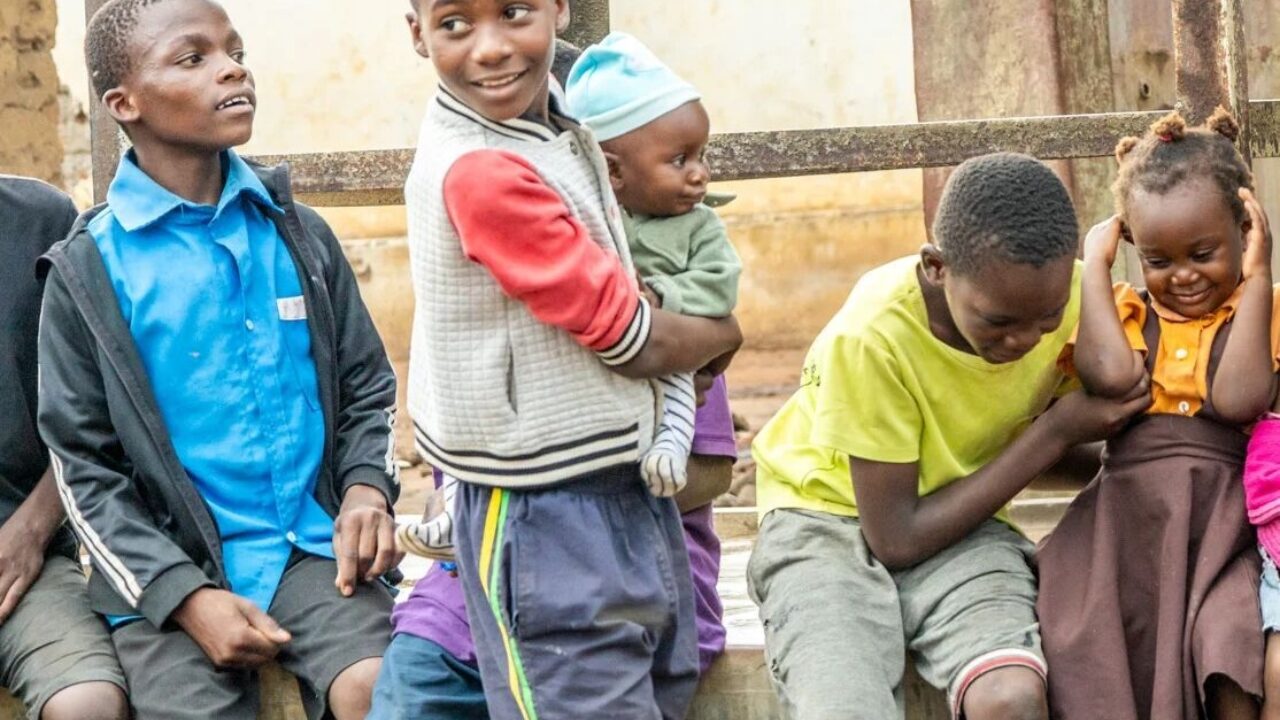
School-based deworming programs continue to demonstrate themselves to be a best buy for development, given extremely low program costs combined with the long-term benefits provided through treatment for individuals and entire communities.
Evidence Action’s Deworm the World Initiative analyzes the cost per child treated in the geographies where we work to provide information on the real costs of deworming. Understanding how the costs per child change with scale and over time is vital for implementation purposes as the global community and policymakers work to secure adequate resources for national deworming programs.
Below is our 2016 cost per child results. In India, we calculated a weighted average of the cost per child in the specific states where we work.

Who is paying?
We include all financial costs necessary to implement school-based deworming in our analysis; this includes costs incurred by Evidence Action, governments, and other partners such as the World Health Organization (WHO) and UNICEF, where applicable. We also include the value of donated drugs, an essential program component. However, we do not include costs that would be incurred otherwise in the absence of a school-based deworming program, such as teacher salaries or government staff time.
Why does the cost per child differ by geography?
Factors of Scale
The programs we support vary significantly in size, from India’s Bihar state program reaching over 34 million school-age children in 2016 to Nigeria’s Cross River State program reaching around 528,000 school-age children. The factor of scale brings down costs dramatically, as seen in India. When the fixed program costs are spread across a large population, the cost per child decreases. Furthermore, using a school-based platform that leverages existing infrastructure means that the incremental costs of reaching additional children are relatively low.
Treatment Strategies
Because children are treated for two types of parasitic worms (schistosomiasis and soil-transmitted helminths) in areas where both species are endemic, treatment strategies can be a key driver of cost. In Kenya and Nigeria, additional costs are incurred due to extra disease mapping requirements and more costly drugs required for the treatment of schistosomiasis in particular.
Cost of “doing business”
The costs of working in certain countries varies substantially depending on each country’s situation and norms. For example, in some countries government staff are paid allowances for their role in the program, such as participating in training activities. This is a driver of higher costs in Kenya and Nigeria as compared to India, for instance, where government officials are not compensated. Travel costs in Nigeria are much higher than those in Vietnam, impacting program costs when personnel must travel to ensure program delivery.
Organizational Partnerships
In some geographies, there are multiple implementing partners with different roles working with governments to support school-based deworming and other endemic neglected tropical diseases. Typically this means there are more activities outside of school-based deworming implementation undertaken, resulting in higher costs.
New Programs
New programs come with start-up costs, as implementation efficiencies have not yet fully been realized. In Vietnam there was a significant lag from the time our work was initiated until the first deworming round due to a need for more intensive planning and advocacy efforts. In Nigeria, we established an organizational presence in order to support the program. We include these start-up costs in our analysis to be as comprehensive as possible, however these costs will not be repeated, leading to lower costs in subsequent years.
How has the cost per child changed over time?

After the first year of deworming in Kenya, we put more resources into policy and advocacy and community awareness, which led to a higher cost per child during 2014 and 2015. The cost per child in Kenya most recently decreased to $0.45 in 2016. Gaining experience from rounds of program implementation, we can recommend to the government changes such as carrying out fewer training sessions, thereby reducing costs. Spending on public awareness has also decreased over time, as communities begin to anticipate the program’s annual rhythm.
In the Indian states of Bihar and Rajasthan, the cost per child also decreased over time as both programs have obtained further economies of scale. The number of children dewormed has more than doubled in Bihar, rising from 16.2 million children to 34.6 million children between 2014 and 2016. In Rajasthan, the number of children dewormed increased by 62% within the same time period (10.8 million in 2014 to 17.6 million in 2016). Although the scale of both programs has grown over time, the costs of key areas like training, material distribution, and community awareness remain relatively stagnant even as more children are reached.
What’s Next?
Various studies such as Miguel and Kremer’s seminal 2004 study, as well as our own analyses, have demonstrated—both through implementation and cost analysis—the low costs of reaching large groups of school-age children. Moving forward, we plan to continue supporting deworming programs in a cost-effective way, encouraging other partners to help maintain low costs while achieving high impact.
Our analysis confirms the achievement of economies of scale for the deworming programs we support, showing that as programs expand their reach, their cost-effectiveness increases. That is certainly good news: stretching each dollar further enables us to reach even more globally at-risk children with deworming treatment. We continue to look for opportunities to help do just that.
For reference to our previous posts on the costs of deworming, you can read this blog post from 2014 deworming rounds and this blog post from 2015 rounds.


