We have written before about how Evidence Action’s Deworm the World Initiative strives not only to be a low-cost program, but also a cost-effective program—one that ensures that the impacts are measurable and the costs are weighed relative to the benefits delivered.
To achieve this goal of cost-effectiveness, we regularly evaluate program cost data. In this post, we explain two critical ways we interact with this information: as part of a continued effort to improve our understanding of program costs, and to improve our programmatic decision-making processes.
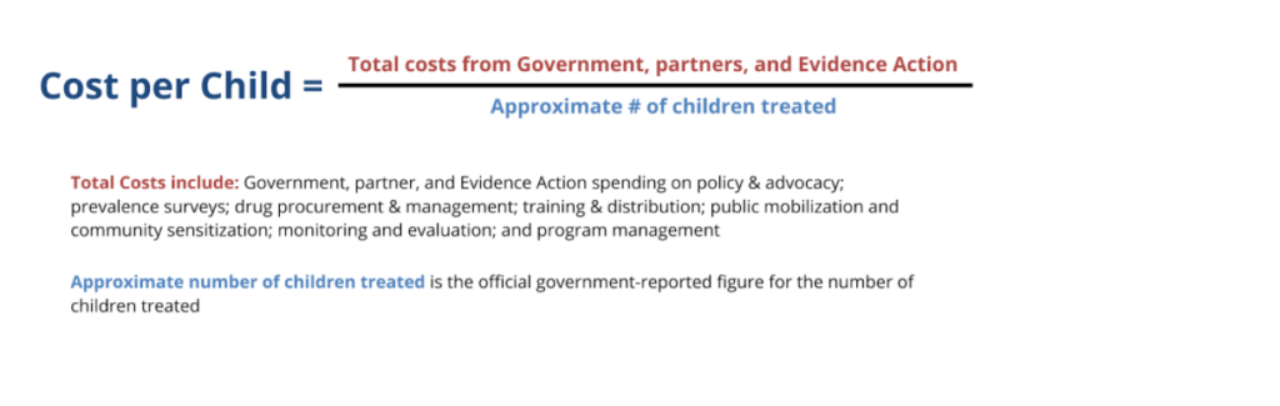
Cost per Child
Every year we calculate a cost per child treated (CPC) metric. It measures the total cost to provide deworming treatment to a child in each geography where Evidence Action operates using our financial data combined with government and partner cost estimates, including the estimated value of donated drugs and amortized costs of surveys to assess worm burden.
To see what we include in our CPC analyses, read our previous blog posts here and here.1
In 2019, our cost-effectiveness team found that the average CPC per treatment across all geographies was $0.07, which is largely influenced by the low costs of treatment and incredible scale of deworming in India. The graph below presents a weighted average of CPC treated across all the sub geographies (states/provinces) for each country where we offer technical assistance. Please note that the differing number of years of data for each country accounts for the varying lengths of time we have provided technical assistance to the corresponding country’s government.
The bolded figures are the weighted CPC for each country in 2019.
Costs differ by geography due to a variety of reasons including the scale of the program, treatment strategies, costs of doing business, implementation partnership relationships, and the amount of time the program has been running. This impacts each country costs differently:
- India: Costs across India are extremely low, largely due to the extensive program coverage and high population treatment targets.
- Nigeria: Higher implementation costs and a smaller treatment population lead to a higher CPC compared to geographies such as India or even Kenya.
- Pakistan: Evidence Action-supported deworming began in two provinces/territories in Pakistan in 2019. As such, we expect to see costs decrease as the program is scaled up to reach more children and start-up costs decrease.
- Kenya: the CPC has fluctuated around the $0.50 mark within the past few years and has mostly stabilized.
Generally, we aim to maintain a benchmark of under $0.50 per child per treatment round. The low CPC treated across the majority of Evidence Action geographies continues to show the high efficiency of the deworming programs implemented by governments with our support.
Application of CPC
The cost per child metric is used differently by external and internal audiences. External to Evidence Action, it helps government implementers and investors, such as individual and institutional donors, in deworming programs to have accurate information about the real costs of an intervention to inform their decisions. We aim to provide both implementers and investors a clear understanding of what their efforts are achieving through measurements related to the benefits of the program and its outcomes, including but not limited to the CPC metric.
Internally, we use the CPC metric to monitor our program and help make decisions that increase impact or reduce costs. The CPC metric provides our program teams with a relative sense of the number of children we are able to reach with a set budget in different geographies and highlights differences in cost requirements between deworming programs. The CPC metric also sits prominently within our decision making framework—the set of key factors that are considered before moving forward with programmatic changes.
When thinking through a new programmatic iteration or treatment strategy change we estimate the expected impact on the CPC and compare it to our existing CPC metric as an internal benchmark. If we estimate that the programmatic change will significantly increase our bottom-line CPC figure, it forces us to hold deeper discussions to weigh the tradeoffs of the change. To facilitate this process, we have developed easy-to-use internal costing tools for various program stakeholders to input expected cost changes so that they can see the projected impacts on the CPC.
These costing tools help guide decision-making across our geographies. For instance, in Sindh, Pakistan, the deworming program is struggling to reach over 80% of the target children using the school-based delivery platform. Approximately 25% of the children in at-risk districts of Sindh are out of school and another 55% of the school-age children are enrolled in private and religious schools that are either unregistered or unregulated by the existing governance structures, making these schools and teachers difficult for the government to access.2 Therefore, we had to explore alternate delivery platforms, such as health workers, to access these hard-to-reach children.
Before exploring other delivery platforms, we used the costing tools to ensure that potential alternatives would be cost-effective. We collected primary data to calculate CPC under different scenarios, including: health workers treating all school-age children in schools and households, and a combination of health workers, teachers, and health facilities delivering treatments in schools and households. Based on our modeling, we projected that it was possible to maintain a CPC close to $0.50 in most of the scenarios. With this information, we were comfortable engaging with government stakeholders to get their feedback and guidance to implement an alternative delivery platform. In close coordination with our implementing partner and government stakeholders, we decided that the program would deliver a round of the deworming treatment in schools and households using only health workers in late 2021.
The continued use of the CPC metric allows our team to better understand our programs and the implications of our decisions—this is particularly critical as we continue to support governments in delivering high quality school-based deworming programs—and work in close partnership with them to refine programs over time for the most cost-effective impact.
1 It is also important to note that comparing the cost per child between years is not necessarily a perfect 1:1 comparison due to improvements and changes to our methodology and costing between years.
2 These figures are calculated using data from the Pakistan Bureau of Statistics 2017 Census as well as data received from education stakeholders in Sindh, Pakistan.
A Note Regarding 2020 Data: COVID-19 Implications |