We use data every day. It’s critically important to our work.
As an evidence-based organization, we rely on high-quality, timely and systematic measurement of inputs, outputs, and outcomes to make decisions about our work, and evaluate our progress. We measure to make decisions; we choose our methods depending on the question we want to answer.
Broadly, there are three categories of data that we use: process, performance and impact data.
Process Data: Are We Doing Our Job?
We measure key aspects of our every-day program operations to ensure that we are doing our job well. In monitoring and evaluation language, we track the inputs and activities (materials, services and systems) that are required to ensure quality implementation of our programs.
Process data is integral to our day-to-day decision making, therefore, we collect it frequently and systematically.
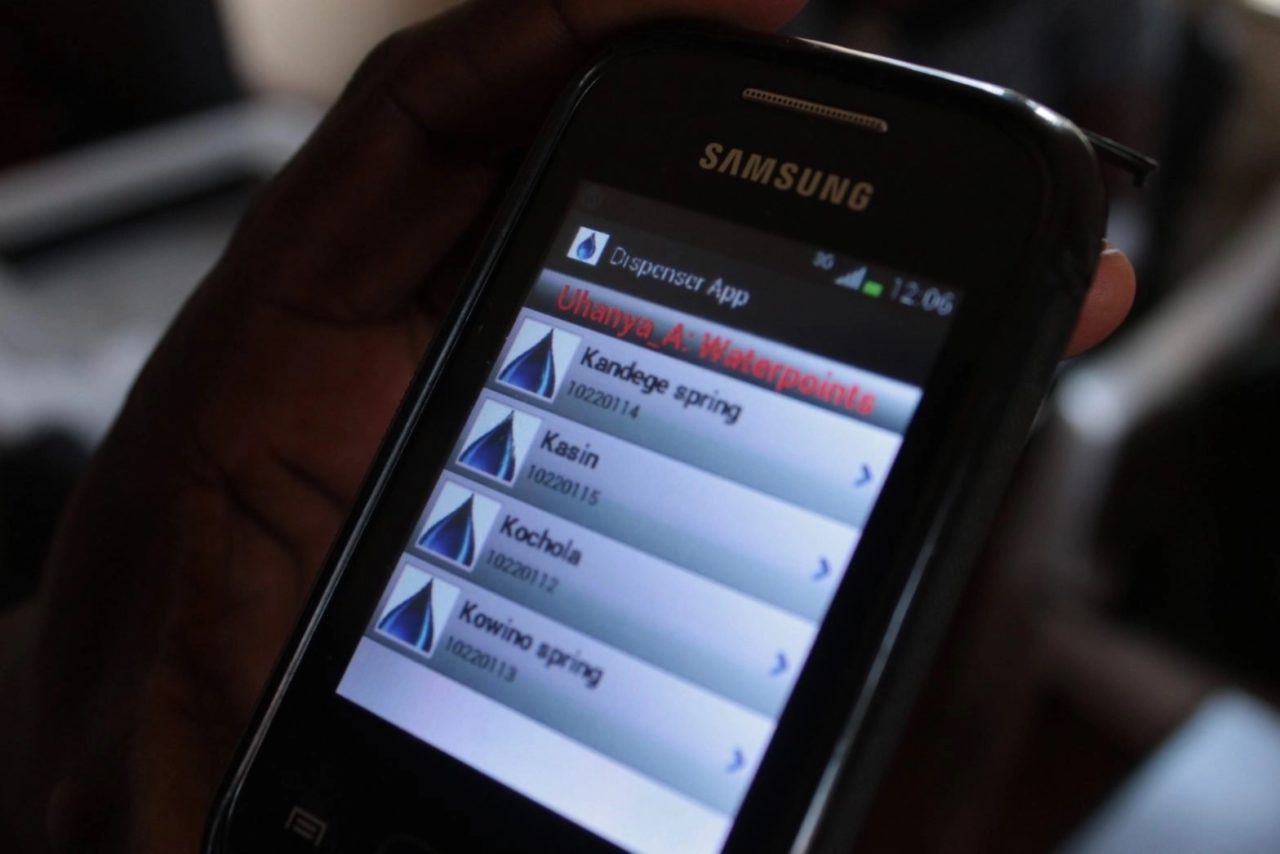
I’ll give you an example: chlorine dispensers (in our Dispensers for Safe Water program) are refilled regularly. Every time chlorine is delivered, dispensers are scrutinized to ensure that the hardware is working correctly and a record is created of the status of the dispenser. Chlorine is delivered to a given dispenser every two months amounting to six checks per dispenser annually. In Kenya alone, there are over 11,000 dispensers. This equates to 66,000 hardware checks and chlorine deliveries to the rural locations where dispensers are installed in just one year. Collecting data on successful delivery of chlorine and maintenance of the dispensers helps us identify any empty chlorine dispensers and determine whether we are meeting our goal that more than 90% of dispensers have chlorine at all times.
Using such process data we know what is happening in our programs every day, and we have vital information to make improvements in our business processes.
Performance Data: Are We Reaching People?
We collect performance data to measure and quantify objectively the reach and size of the target populations of our programs. Not to be confused with ‘impact data’, performance data are not representative of changes effected by the program but rather represent the ‘extent’ of our work.
Here is an example: We want to know every month what percentage of households that we serve are ‘adopting’ the use of chlorine from Dispensers. We measure this by collecting data on the percentage of representative randomly sampled households whose water tests positive for chlorine during unannounced home visits.
During these visits, our monitors use a simple testing kit to identify whether there is residual chlorine present in a given household’s drinking water.
This gets a little geeky but follow along: Evidence Action’s independent monitors check at least 1.5% of all dispensers that we have installed every month. This percentage is derived from balancing the sample size required to be (statistically) confident that we are measuring a ‘true’ adoption rate and some logistical constraints.
With an average field office currently managing about 1000 dispensers, this means that we visit approximately 15 randomly selected dispensers per month for evaluation for every field office. Monitors, in turn, can physically visit about eight (randomly selected) households per day in each dispenser area to test household water samples. So, we have water samples from 120 households per field office every month.
When this information is aggregated across all our offices, across all three countries in which dispensers are installed, we often have over 1,300 test results every month, or 15,600 per year – all measuring whether there is actually chlorine in the water that people use in their homes.
We give updated results of key performance data to our program teams every month. This allows them to track trends over time and gives them the ability to course correct if the performance data veers off track.
Impact Data: Are we Effecting Change?
There is rigorous evidence demonstrating the positive health impacts of point-of-use water chlorination (see Arnold & Colford, 2007; Clasen et al., 2009; Fewtrell, 2004). We blogged about this evidence in detail here. This rigorous evidence is the basis for our confidence in the impact of our work when we know that we provide a quality service. We measure the quality of service by the indicators we outlined above.
When our process and performance data shows us that we are delivering quality services, we can then extrapolate and report statistics such as the total cases of childhood diarrhea prevented and disability-adjusted life years averted, as the result of the program activities. However, these extrapolations can’t be interpreted in a causal way and we don’t emphasize this exercise a lot for internal purposes. Precisely because we are operating at scale, we don’t have a representative control group against which to compare outcomes in our community.
Everything we do at Evidence Action aims to fill the gap between knowing what “works” and then having impact at scale. We do this by growing programs that are backed by a rigorous body of prior evidence and then develop best practice operational models and innovative financing mechanisms to grow these proven interventions so that they reach millions of people. At scale, we focus on quality services delivered sustainably, and collect data to measure success in achieving this goal accordingly.
So? We Love (and Need) Data
Evidence Action collects process data to make decisions and innovate on our business processes on a daily basis; we use performance data to track what our reach is with our programs, and we determine our impact to show we are actually achieving what we set out to do. For Evidence Action, rigorous collection of data underpins the notion of working with ‘proven’ interventions and it is integral to the continuous successful scale-up of all of our programs.
Editor’s Note: Rebecca King is a Senior Associate in Evidence Action’s Monitoring, Learning, and Information Systems team in Nairobi, Kenya.